Appearance
Sales analytics
Crosslist gives you a centralized overview of your sales performance across all connected marketplaces.
Sales analytics helps you track revenue, profit, fees, expenses, marketplace performance, and sales trends over time. You can use it to understand where your sales are coming from, which items perform best, and how profitable your sales are after costs and fees.
Sales are detected automatically on the marketplaces or can be added manually if missing. Learn more about sales tracking here
INFO
To use this feature you need the Gold or Diamond subscription
Open sales analytics
To open your sales analytics:
Navigate to the Analytics page. Use the available tabs to switch between:
Analytics tab
The Analytics tab gives you a detailed overview of your recorded sales.
You can use this page to:
- Search for a specific sale
- Filter sales by marketplace
- Filter sales by date range
- Review sale-level revenue, fees, expenses, and profit
- Export your sales data to CSV
- Customize visible columns
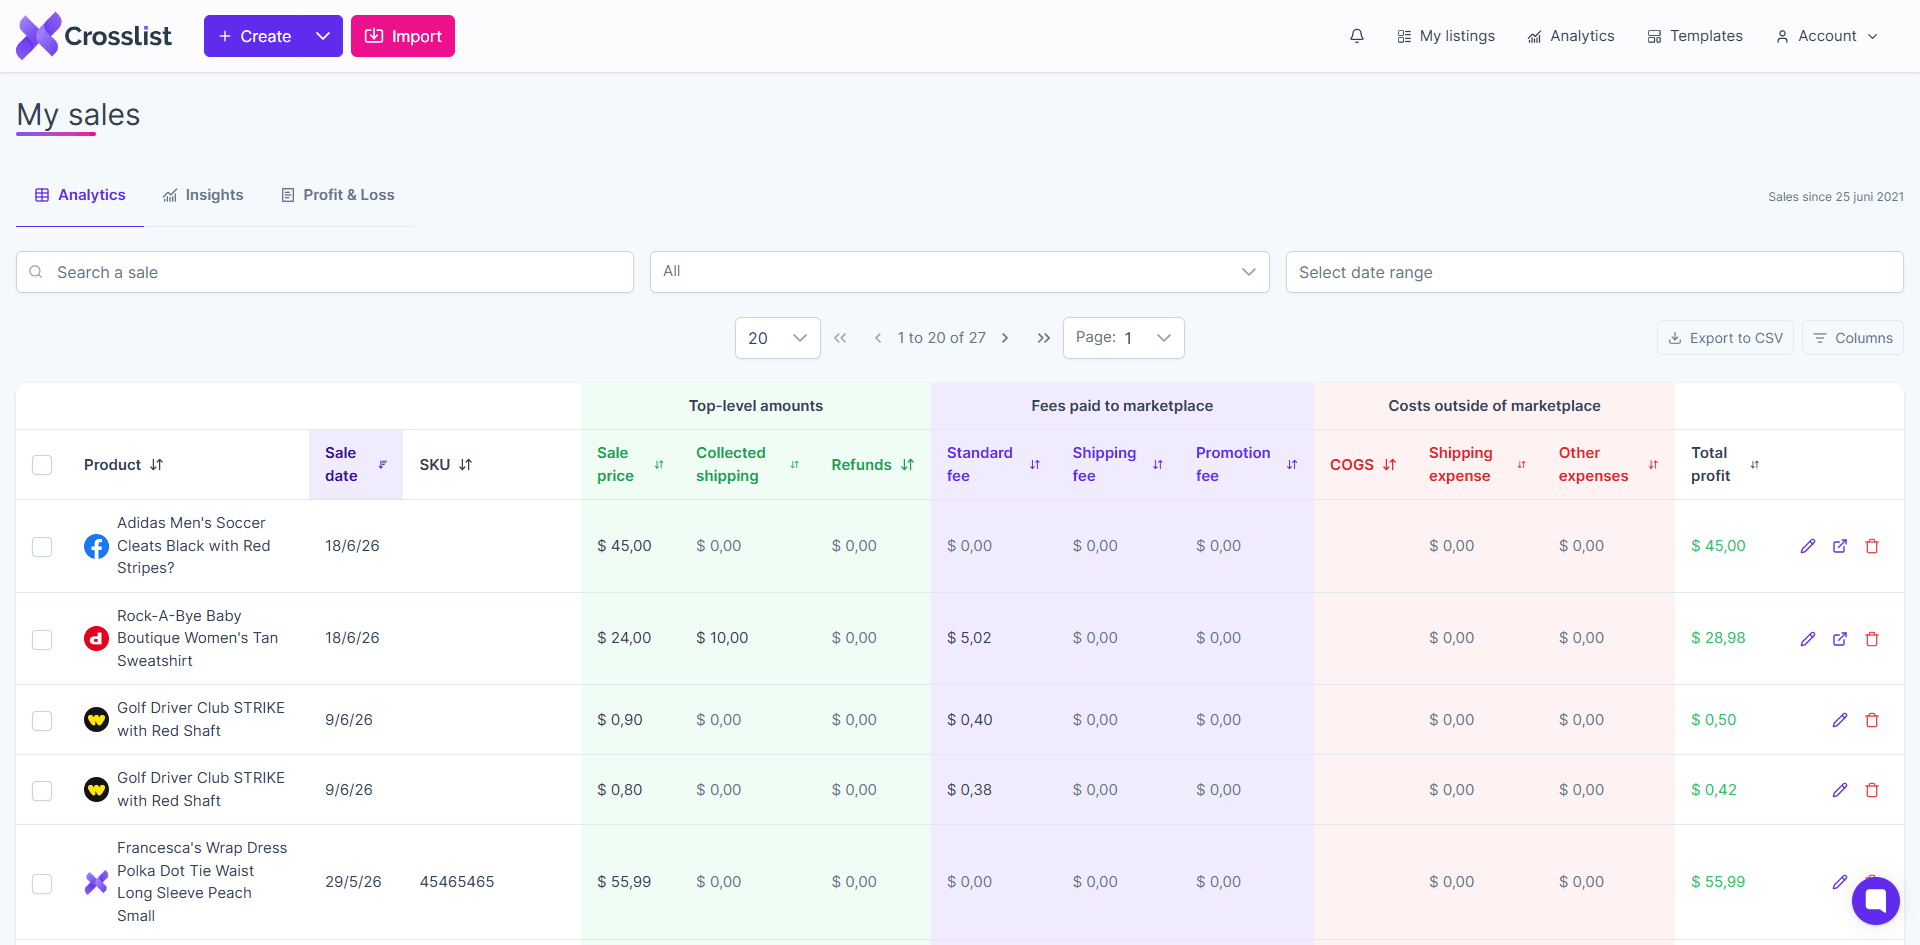
Sales table
The sales table shows each recorded sale as a separate row.
Each sale includes the product, marketplace, sale date, financial details, and estimated profit.
| Column group | Explanation |
|---|---|
| Product | Shows the sold product, marketplace icon, and product title. |
| Sale date | Shows when the sale happened. |
| SKU | Shows the SKU connected to the sold listing, if available. |
| Top-level amounts | Shows sale price, collected shipping, and refunds. |
| Fees paid to marketplace | Shows standard fees, shipping fees, and promotion fees. |
| Costs outside of marketplace | Shows cost of goods, shipping expenses, and other expenses. |
| Total profit | Shows the estimated profit or loss for the sale. |
You can sort several columns to compare sales by date, price, fees, costs, or profit.
Export sales to CSV
You can export your sales data from the Analytics tab.
To export your sales:
- Open the Analytics tab
- Apply any filters you want to use
- Click Export to CSV
The exported file can be used for external reporting, accounting, or deeper analysis.
Insights tab
The Insights tab gives you a visual summary of your sales performance.
You can filter the insights by period and marketplace.
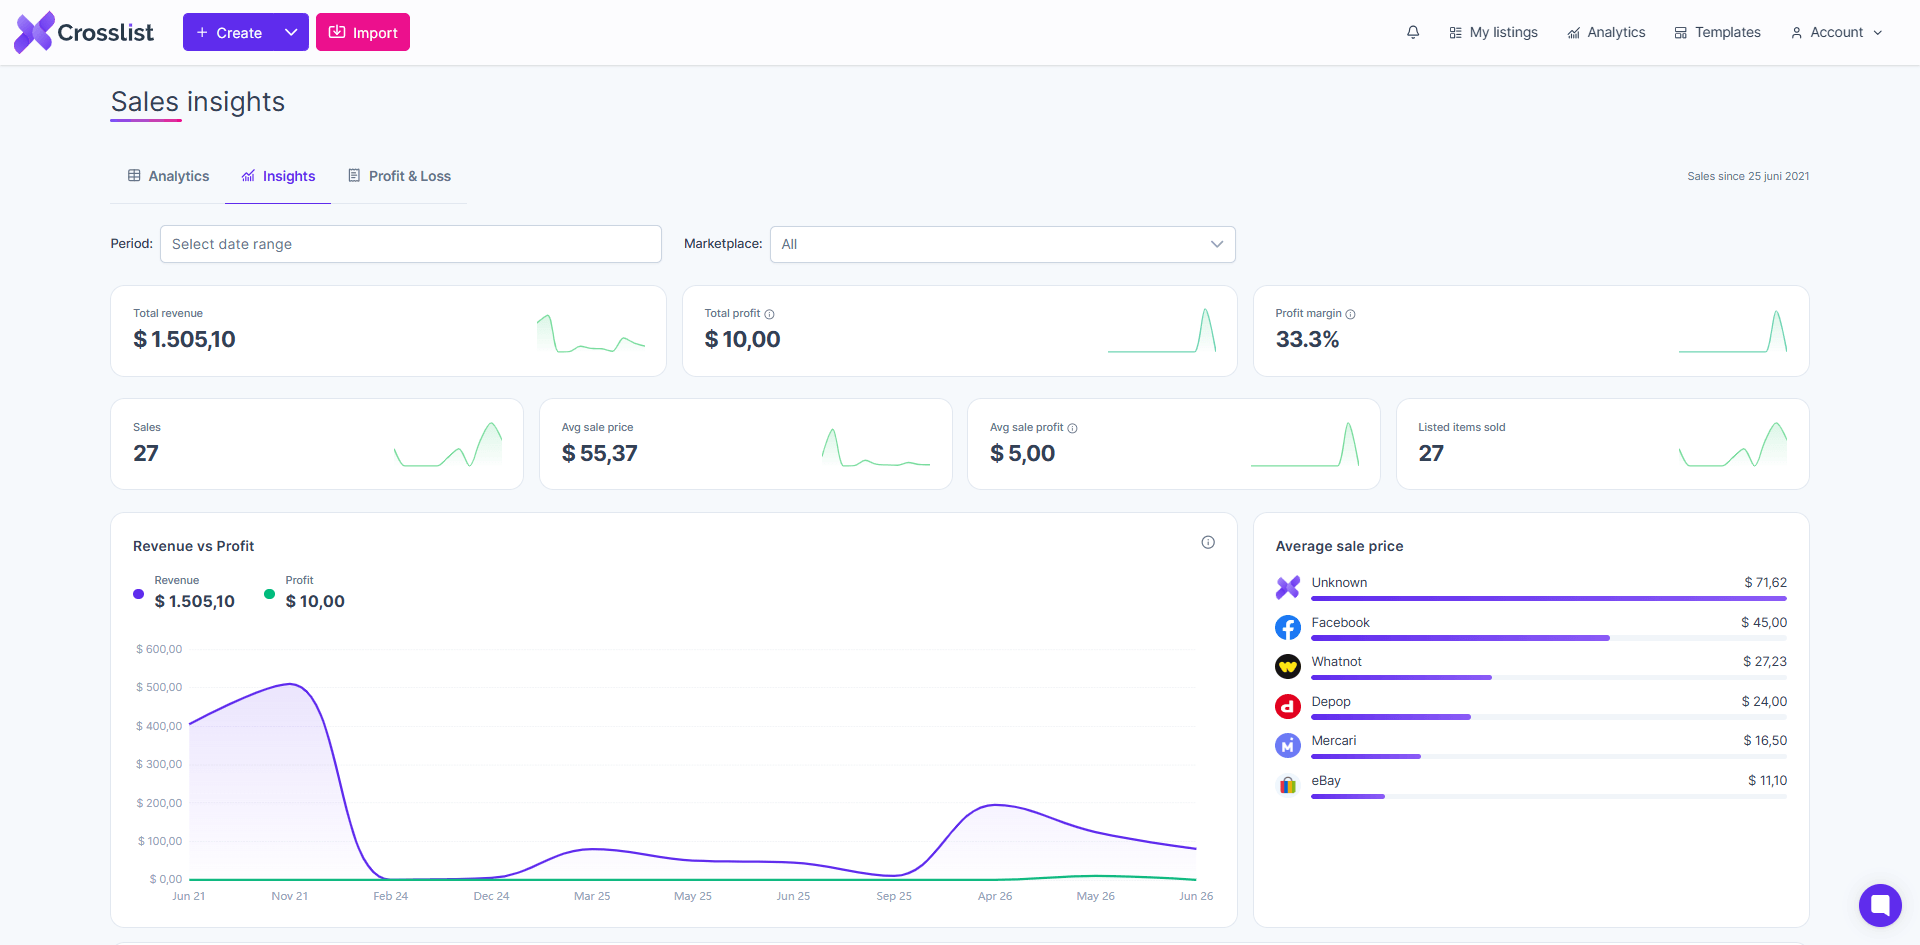
The top cards summarize your most important sales metrics.
| Metric | Explanation |
|---|---|
| Total revenue | The total revenue recorded for the selected period and marketplace filter. |
| Total profit | The estimated profit after fees, costs, refunds, and expenses. |
| Profit margin | The estimated profit margin based on your recorded sales data. |
| Sales | The total number of recorded sales. |
| Average sale price | The average sale price across the selected sales. |
| Average sale profit | The average estimated profit per sale. |
| Listed items sold | The number of listed items that were sold. |
WARNING
Sales analytics are only as accurate as the information saved in your sales records.
For the most accurate profit reporting, make sure your sale price, fees, cost of goods, shipping expenses, refunds, and other expenses are filled in correctly.
Revenue vs profit
The Revenue vs Profit chart compares your total revenue with your estimated profit over time.
This helps you understand whether your sales are actually profitable after fees and expenses.
Average sale price by marketplace
The Average sale price chart shows the average sale price per marketplace.
This can help you identify which marketplaces generate higher-value sales and where your lower-value sales are coming from.
Marketplace comparison
The marketplace comparison chart lets you compare performance across marketplaces.
You can switch between:
- Revenue
- Profit
- Margin
- Fees
- Sold
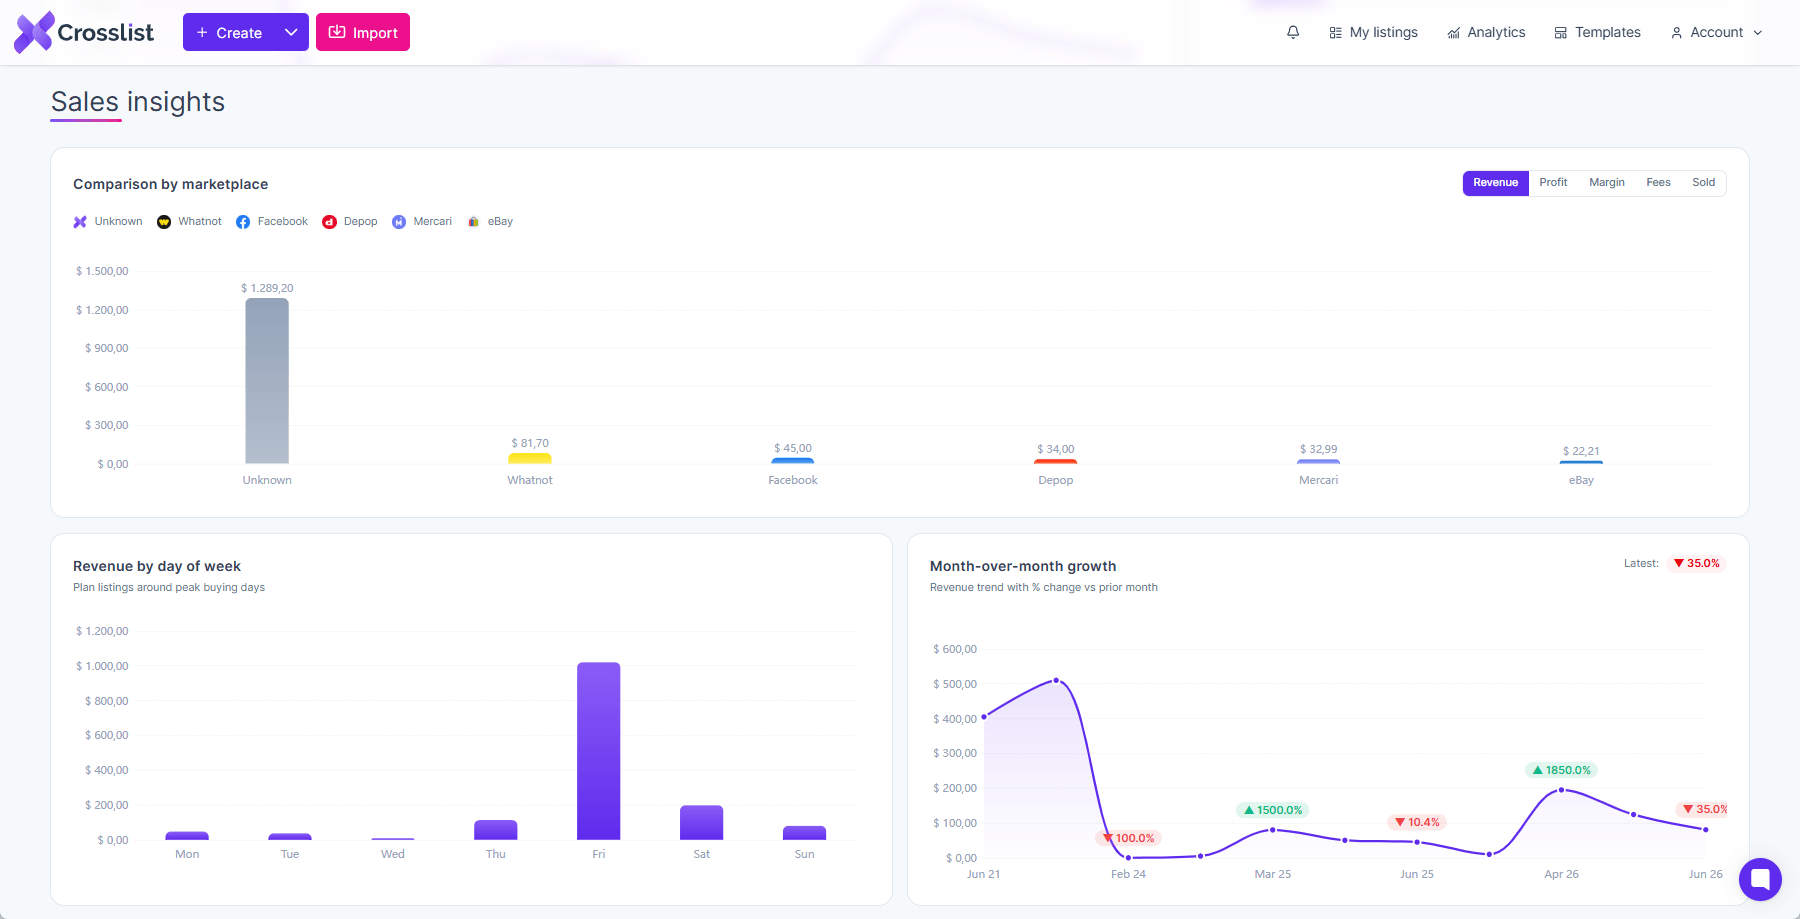
This helps you compare marketplaces based on more than just revenue. For example, one marketplace may generate more sales, while another may produce a better profit margin.
Revenue by day of week
The Revenue by day of week chart shows which weekdays generate the most revenue.
You can use this to identify stronger selling days and plan listing, relisting, or promotional activity around peak buying days.
Month-over-month growth
The Month-over-month growth chart shows how your revenue changes compared with the previous month.
This helps you spot growth trends, slow periods, and recent performance changes.
Top selling brands
The Top selling brands chart shows which brands generated the most sales.
You can use this to understand which brands perform best in your inventory and where you may want to focus future sourcing. 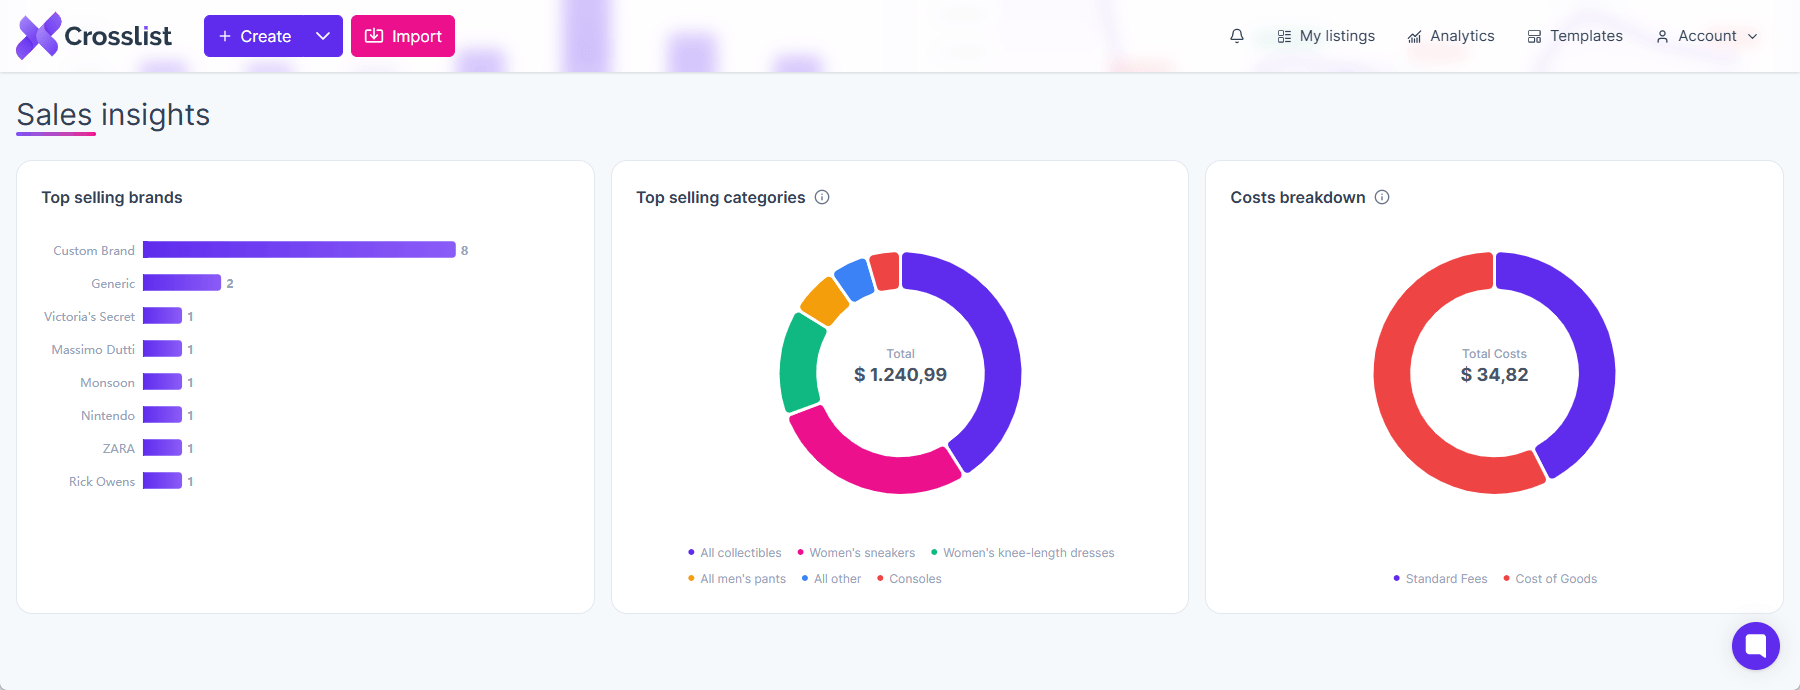
Top selling categories
The Top selling categories chart shows which categories generated the most revenue.
This helps you understand which product categories are driving your sales.
Costs breakdown
The Costs breakdown chart shows how your costs are distributed.
This can include:
- Cost of goods
- Standard fees
- Shipping fees
- Shipping expenses
- Promoted fees
- Other expenses
Use this chart to quickly identify which costs have the biggest impact on your profitability.
Profit & Loss tab
The Profit & Loss tab gives you a more structured view of your revenue, costs, expenses, and net profit.
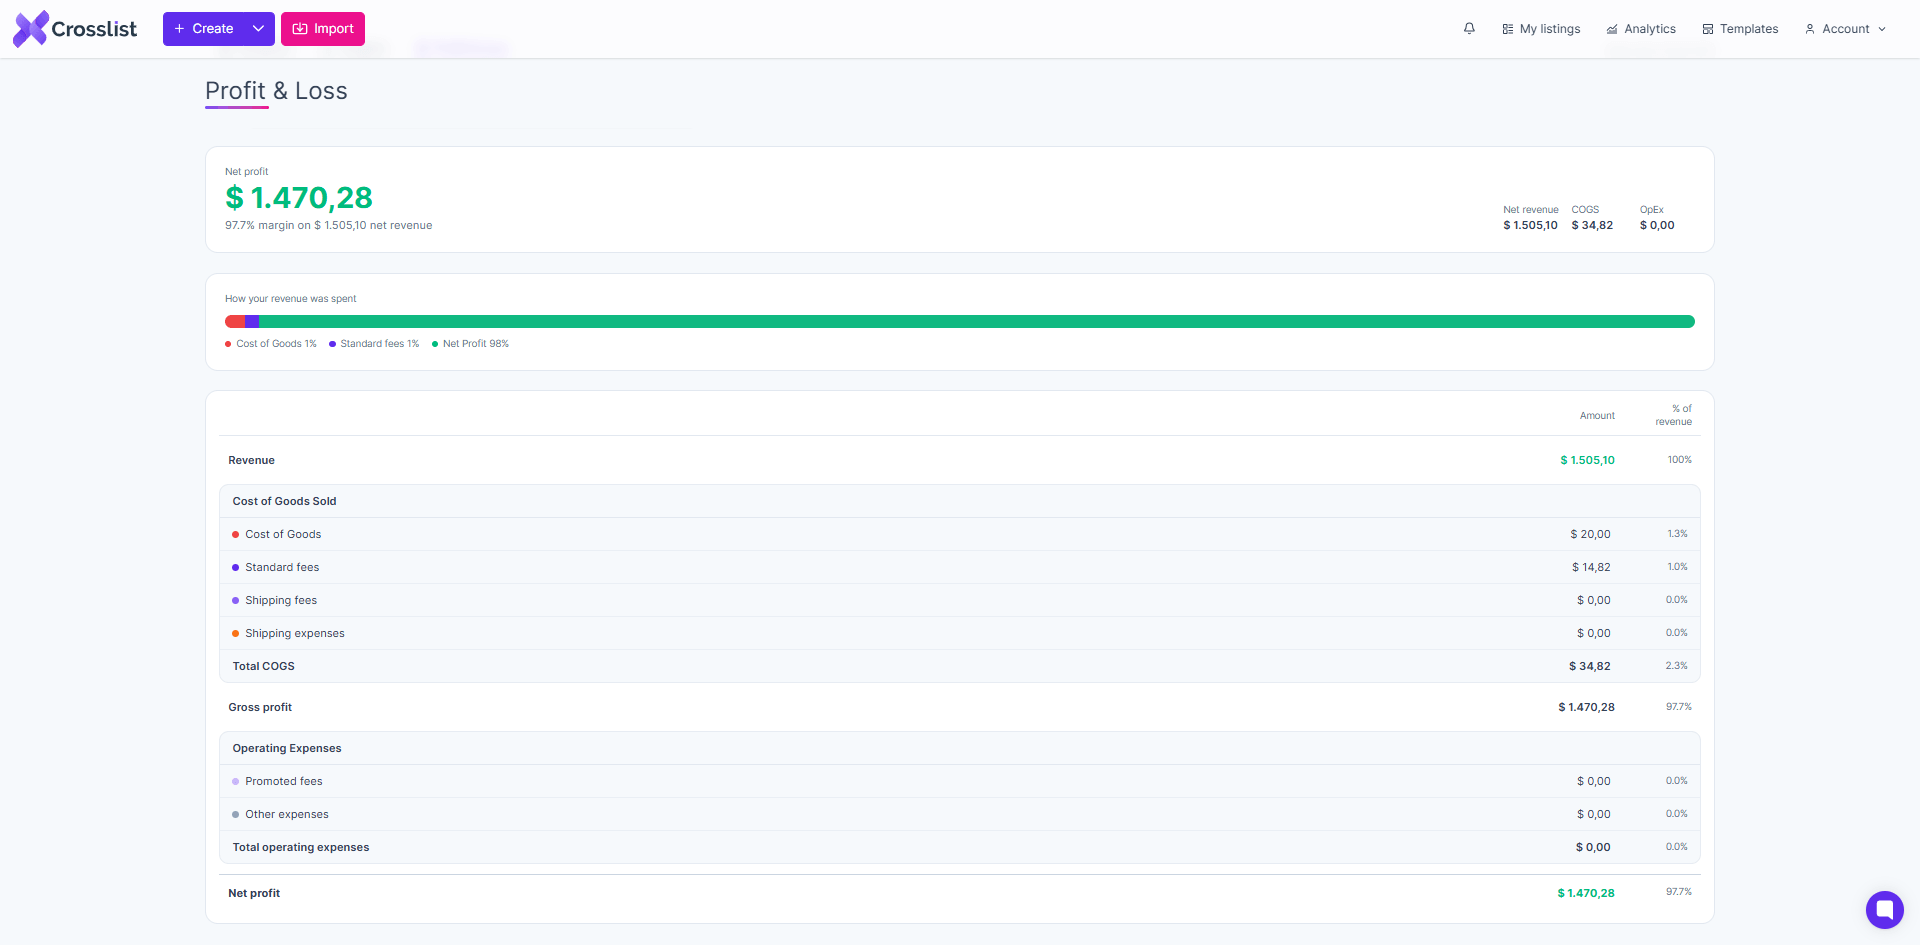
This page summarizes:
- Net profit
- Net revenue
- Cost of goods sold
- Operating expenses
- Profit margin
- How revenue was spent
Profit & Loss breakdown
The Profit & Loss table is divided into several sections.
| Section | Explanation |
|---|---|
| Revenue | Your recorded sales revenue for the selected period. |
| Cost of Goods Sold | Costs directly connected to the sold item, such as cost of goods, standard fees, shipping fees, and shipping expenses. |
| Gross profit | Revenue minus cost of goods sold. |
| Operating Expenses | Additional expenses, such as promoted fees and other expenses. |
| Net profit | The final estimated profit after costs and expenses. |
How profit is calculated
Crosslist calculates estimated profit based on the information available in each sale.
This can include:
- Sale price
- Collected shipping
- Refunds
- Cost of goods
- Standard fees
- Shipping fees
- Promoted fees
- Shipping expenses
- Other expenses
In general, profit is calculated as:
Sale revenue minus refunds, fees, cost of goods, shipping expenses, and other expenses.
Best practices
To get the most value from sales analytics:
- Add missing financial details to your sales
- Keep cost of goods updated on your listings
- Review fees and expenses after each sale
- Use date filters to compare performance over time
- Compare marketplaces by profit, not only revenue
- Export your sales regularly if you use external accounting tools
Limitations
Sales analytics depend on the sales data available in Crosslist.
Some data may be incomplete when:
- A sale was added manually without all financial fields
- Marketplace fees were not available automatically
- Cost of goods was not entered
- Shipping expenses were not added
- A sale happened before sales tracking was enabled
You can edit sales manually at any time to complete missing information and improve the accuracy of your analytics.
It's currently not possible to add sales for marketplaces that aren't supported by Crosslist.